Brawl Stars has almost 200 distinct maps. With the daily Map Maker Competition Winner, there is a new map available to play every day. Unarguably, some maps must be better than others. How can we measure that?
Players enjoy playing their favorite Brawlers and trying different team compositions. Let us assume that the best maps are the most diverse maps: On a perfect map, every Brawler would be equally viable and fun to play. Now we will also assume that players notice when certain Brawlers are not viable or not fun on a map, so they will prefer different, more viable Brawlers instead.
We can put this assumption into numbers: With more and more battles being played on a particular map, the use rate of viable Brawlers will be high and the use rate of not so viable Brawlers will be low. Ideally, for a map where every Brawler was equally viable, the use rates of all Brawlers would be the same.
Using the Brawl Time Ninja Map Tier Lists, we can quickly compare the use rates of all Brawlers with the "Graph" Layout. Below is a screenshot of Gem Grab - Corner Case, a recent map for which Brawl Time Ninja has recorded about 150 000 battles for the past month.
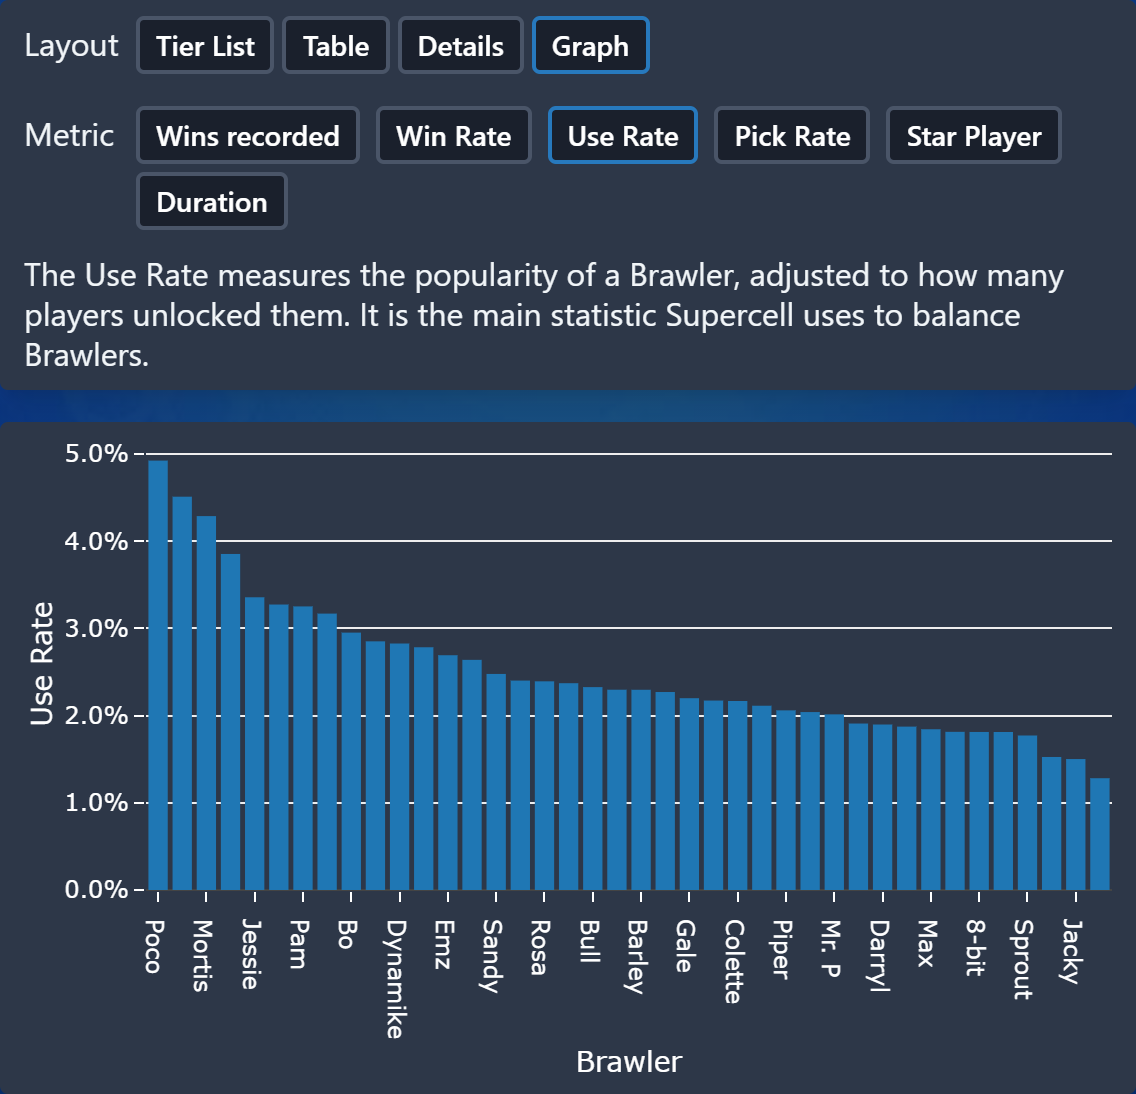
In this graph, the use rates of most Brawlers are between 1.5% and 3.5%. The highest use rate is Poco's at 4.9%. The top 5 Brawlers make up 21% use rate in total.
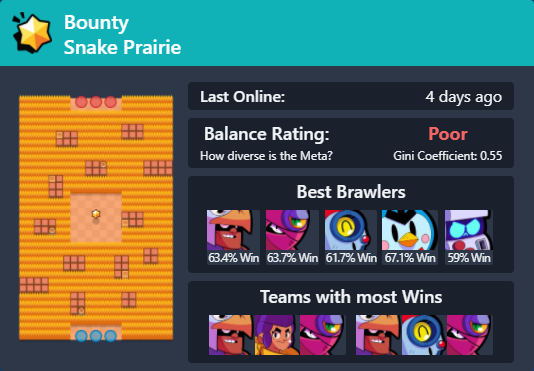
Let us compare this graph with the graph for Bounty - Snake Prairie, a map with about 90 000 recorded battles:
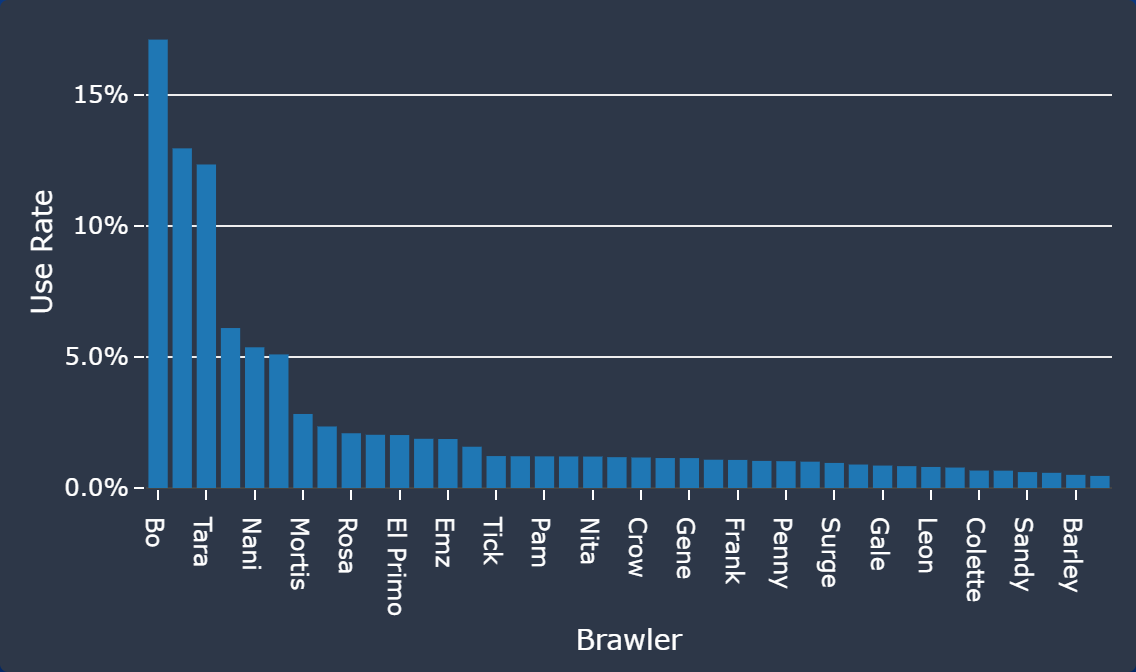
The scale of the Y axis is different here, going from 0% to 15% instead of 0% to 5%. The distribution is a lot less even and dominated by few Brawlers. The majority of Brawlers have a use rate close to 1%, with three (Bo, Shelly and Tara) above 10% use rate. The top 5 Brawlers make up 53.4%! You are almost guaranteed to meet one of the top 5 in every Battle.
Playing on Snake Prairie is probably fun every once in a while, but playing against the same team compositions every Battle is repetitive. For the long term, Corner Case is a much better map compared to Snake Prairie.
We have explored and validated our method and saw that we can use it to judge the map meta quality. Now we need to find a metric that captures our intuition in a number. Luckily, statistics has a tool for us: The Gini coefficient, which is commonly used to calculate the inequality of wealth. It measures the evenness of a distribution, in our case the evenness of Brawler use rates. There are a few different formulas for different applications - Brawl Time Ninja uses the formula that calculates it as half of the relative mean absolute difference. Without going further into detail, all you need to know is: With a perfect map, when the use rates are the same for all Brawlers, the Gini coefficient is 0. On the least diverse map imaginable, one Brawler has 100% use rate and all others 0% and the Gini coefficient is 1.
For Snake Prairie, the Gini coefficient is 0.55. Corner Case has a much lower Gini coefficient of 0.17. Looking at a few maps, the Gini coefficient is about 0.32 on average, with 1 out of 4 maps having a Gini coefficient better than 0.225 and 1 out of 4 maps having a Gini coefficient worse than 0.425. To help you in interpreting these numbers, Brawl Time Ninja labels them from "Excellent" to "Awful".
Great! We can now use the Gini coefficient to objectively compare maps. You can view the Gini coefficient as "Balance Rating" in the map details card on every Map Tier List page. For example, take a look at how good the Map Maker Competition Winner Maps have been so far.